In industries where nitrogen consumption fluctuates throughout the day, choosing the correct capacity of a PSA nitrogen plant becomes a critical decision. A wrong selection often leads to oversized plants, unnecessary costs, and higher operational expenses.
This blog, Part I of our 2-part series, explores how to size a PSA nitrogen plant for industries where nitrogen usage varies with working hours. (In Part II, we will cover industries with sudden spikes in nitrogen demand due to specific operational processes.)
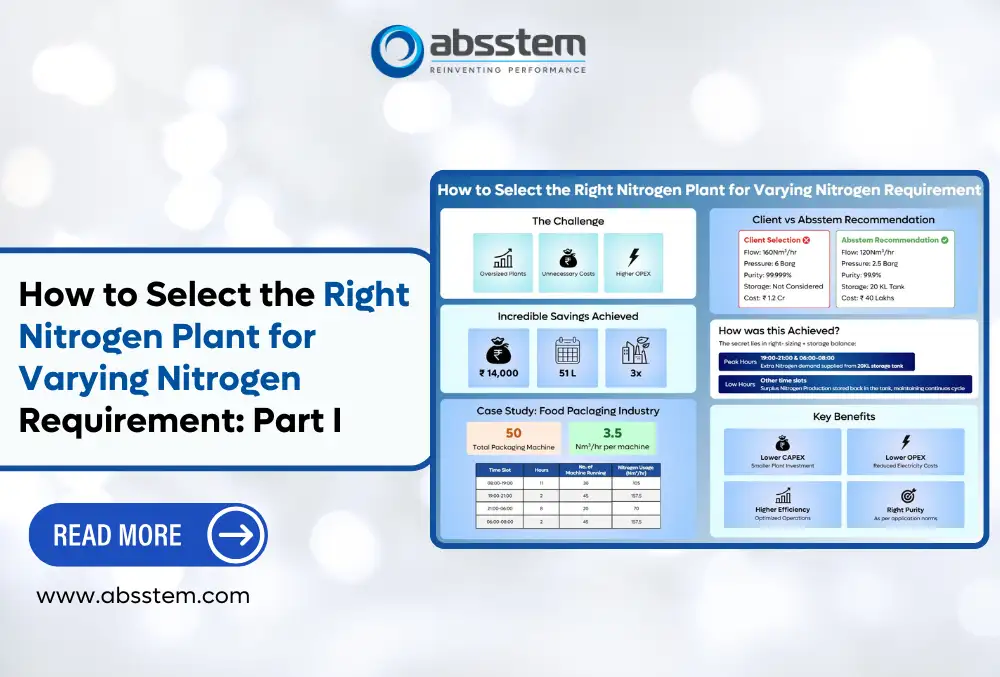
We illustrate this with a case study from the Food Packaging Industry, where nitrogen consumption changes with machine usage across different shifts.
Case Study: Food Packaging Industry
A client with multiple packaging machines faced challenges due to varying nitrogen usage across shifts.
Machine Data
- Total packaging machines: 50
- Nitrogen usage per machine: 3.5 Nm³/hr
| Time Slot | Hours | Machines Running | Nitrogen Usage (Nm³/hr) |
| 08:00 – 19:00 | 11 | 30 | 105 |
| 19:00 – 21:00 | 2 | 45 | 157.5 |
| 21:00 – 06:00 | 8 | 20 | 70 |
| 06:00 – 08:00 | 2 | 45 | 157.5 |
As you can observe, the nitrogen usage varies throughout the day, and it becomes difficult to select the right size of PSA Nitrogen plant in this case.
Client selected the PSA nitrogen plant with the following specs:
- Nitrogen Flow: 160 Nm³/hr
- Pressure at Usage Point: 6 Barg
- Purity: 99.999%
- Storage Tank: Standard OEM package
As we have already explained the impact of purity on the cost of nitrogen (please read our blog titled Comparison of the Cost of Nitrogen Gas from Different Sources (1)), we understand that in this case, 99.9% nitrogen purity is what is required as per the EIGA norms. Please read the article titled Food Safety First! Demystifying Food-Grade Nitrogen & EIGA Doc 941 (2).
Well, after understanding the Nitrogen usage pattern from the client, we came up with a different solution:
- Nitrogen Flow: 120 Nm³/hr
- Pressure at usage point: 2.5 Barg
- Purity required: 99.9% (as per EIGA food packaging norms)
- Storage Tank Volume: 20 KL
Savings: Client vs. Absstem Recommendation
| Parameter | Client Selection | Absstem Recommendation |
| Nitrogen Flow | 160 Nm³/hr | 120 Nm³/hr |
| Nitrogen Purity | 99.999% | 99.9% |
| Plant Cost | ₹1.2 Cr | ₹40 Lakhs |
| Compressed Air Requirement | 760 CFM | 230 CFM |
| Compressor Power | 110 kW | 37 kW |
| Daily OPEX (Electricity) Electricity @ ₹8/unit | ₹21,000 | ₹7,104 |
| Maintenance Cost | High | Low |
Daily Saving: ₹14,000/
Annual Saving: ~₹51 Lakhs
CAPEX Reduction: 3x cheaper plant
How Was This Saving Achieved?
The secret lies in right-sizing + storage balance:
- During peak hours (19:00-21:00 and 06:00-08:00), extra nitrogen demand is supplied from the 20 KL storage tank.
- During lower demand hours, any surplus nitrogen produced by the PSA is stored in the storage tank, maintaining a continuous cycle and desired buffer.
Tank Calculation Example
- Tank Capacity: 20 KL
- Pressure: 6.5 Barg → 130 m³ stored [Volume of gas stored in a tank = Volume of tank X Pressure → 20 x 6.5 = 130 m3]
- In this case, Volume of gas stored in 20 KL tank: 20 x 6.5 = 130 M3
- Usable Nitrogen (after 2.5 Barg cutoff): 80 m³ [Usable Nitrogen stored in Tank = Total gas stored in tank – Non-useable gas volume in tank → 130 – (20 x 2.5) = 80 m³]
During the 2-hour peak period (19:00 – 21:00), the additional nitrogen required is 75 Nm³ [(157.5 – 120)×2], which is supplied from the storage tank. By the end of this interval, the tank pressure drops to 2.75 Barg.
After 21:00, consumption falls to 70 Nm³/hr for the next 8 hours. The plant produces more than needed (120 – 70 = 50 Nm³/hr), so the surplus is stored in the tank, gradually restoring its pressure to 6.5 Barg.
This reserve is then utilised again during the next 2-hour peak (06:00 – 08:00), covering the 75 Nm³ shortfall and bringing the tank pressure back down to 2.75 Barg.
From 08:00 onwards, consumption reduces to 105 Nm³/hr for 11 hours, creating another surplus of 15 Nm³/hr, which replenishes the storage tank until it once again reaches 6.5 Barg.
This cycle repeats, ensuring a stable supply without oversizing the nitrogen plant. This ensures that a 120 Nm³/hr plant is sufficient instead of a 160 Nm³/hr plant, resulting in drastic reductions in both CAPEX and OPEX.
Nitrogen usage with a 20 KL storage tank and a 120 Nm³/hr nitrogen plant
| Time | No. of Hours | Packaging Machines in Use | Nitrogen Usage (Nm³/hr) | Storage Tank Pressure (Barg) | Storage / Usage from Tank |
| 08:00 – 19:00 | 11 | 30 | 105 | 6.5 at 19:00 | 15 Nm³/hr stored in tank |
| 19:00 – 21:00 | 2 | 45 | 157.5 | 2.75 at 21:00 | 75 Nm³ used from tank |
| 21:00 – 06:00 | 8 | 20 | 70 | 6.5 at 06:00 | 50 Nm³/hr stored in tank |
| 06:00 – 08:00 | 2 | 45 | 157.5 | 2.75 at 08:00 | 75 Nm³ used from tank |
Conclusion
For industries with variable nitrogen usage across working hours, adding the right storage tank with a smaller PSA nitrogen plant is a smarter choice than oversizing the system. This approach ensures:
- Lower CAPEX
- Lower OPEX
- Higher efficiency
- Optimised purity levels as per application norms
Stay tuned for Part II, where we’ll discuss industries with sudden nitrogen demand spikes.
Consult Us
Looking to optimise your nitrogen cost? Contact our experts:
- Email: [email protected]
- Phone: 1800 3010 3394
- Website: absstem.com
References
- Absstem Technologies. (2025). Comparison of the Cost of Nitrogen Gas from Different Sources
- Sahni, Amit. LinkedIn (2025). Food Safety First! Demystifying Food-Grade Nitrogen & EIGA Doc 941