This article continues our blog series:
- Do We Really Know Our Gas Consumption and Cost? Part I (1)
- Do You Really Know Your Gas Consumption and Cost? – Part II (Liquid Nitrogen) (2)
- Do You Really Know Your Gas Consumption and Cost? – Part III (Nitrogen Cylinders) (3)
In this series, we explained how confusion in gas measurement units can lead to costly errors. This time, we shift focus to Liquid Oxygen (LOX) – exploring its technical, financial, and operational aspects, including:
- The impact of the unit of measurement (UOM) on actual consumption and costs
- How liquid oxygen is stored, consumed, and billed
- The hidden costs and wastage losses involved(evaporation, filling, and leftover gas)
- How PSA Oxygen Plants can cut costs by more than half
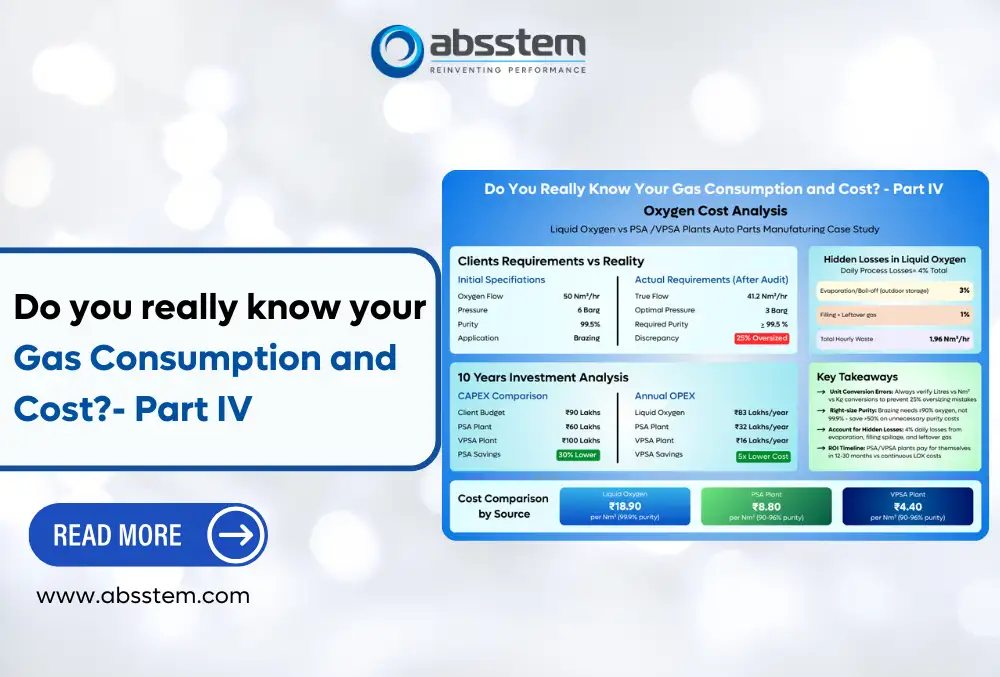
Case Study: Auto Parts Manufacturing Industry (Brazing Application)
A client from the auto parts manufacturing sector approached us with a request to set up a PSA Oxygen Plant for brazing. Their initial specifications:
- Oxygen Flow: 50 Nm³/hr
- Pressure at usage point: 6 Barg
- Purity required: 99.5%
To ensure that our proposal is technically in line with the customer’s specifications, we requested the customer to visit their facility to validate these requirements.
Our team visited the client site and conducted a detailed audit of the customer’s process, application, and associated gas requirements in terms of Oxygen flow, purity and required pressure at the point of use.
Since the customer was already using a liquid Oxygen setup in their plant, we studied their current usage patterns, refilling and billing cycles, to gain a detailed understanding from a techno-commercial perspective. Below is a gist of the observations made by our team:
Oxygen Purity Analysis
- Oxygen Purity required for Brazing: ≥ 90%
- Default Liquid Oxygen Purity: 99.9% – (higher than required)
- Oxygen Production Cost by Purity
| Purity | Cost (₹/Nm³) | Source |
| 99.9% | ₹18.90 | Liquid Oxygen |
| 90–96% | ₹8.80 | PSA Oxygen Plant |
| 90–96% | ₹4.40 | VPSA Oxygen Plant |
Note: Electricity cost assumed at ₹8/unit.
- Key Insights
- The Oxygen purity of 90-96% is widely acceptable in brazing applications.
- PSA Oxygen plants can generate Oxygen as per the required purity level, thereby providing significant monetary savings on the production costs. The evidence (explained above) demonstrates that production costs are reduced by more than 50%.
- There are also additional cost benefits that arise from lower maintenance and operational costs. Selecting the right Oxygen purity reduces the overall life cycle cost of a PSA plant.
- To read more about the cost implications of Oxygen purity, please read our blog titled, Comparison of the Cost of Oxygen Gas from Different Sources (4).
- Key Insights
Oxygen Flow Calculation Error
To determine the Oxygen gas flow required for the application, we asked the customer to explain how they calculated the value mentioned in their RFQ (50 NM³/hr). They told us that they had reviewed their liquid Oxygen supplier’s invoice and divided the total Oxygen gas volume by the total working hours. While this method was theoretically acceptable, it overlooked one critical factor – the Unit of Measurement (UOM).
The requirement was calculated based on the following data:
| Parameter | As per Invoice |
| Oxygen filling per month | 36,000 L |
| Oxygen cost | ₹20/L |
| Oxygen consumption/hour | 50 L/hr |
| Monthly Tank Rental Cost | ₹25,000/- |
What’s wrong with this data? As visible from the above, the client divided the liquid Oxygen volume directly by hours, ignoring the unit conversion.
After factoring in the UOM conversions, we found the actual usage was much lower.
Please look at the table below:
| Parameter | As per Invoice | After Correct Conversion | Calculation / Explanation |
| Oxygen filling per month | 36,000 L | 31,104 Nm³ | 1 L LOX = 0.864 Nm³ 36,000 × 0.864 = 31,104 Nm³ |
| Oxygen cost | ₹20/L | ₹23.14/Nm³ | Cost per Nm³ = ₹20 ÷ 0.864 = ₹23.14 per Nm³ |
| Oxygen consumption per hour | 50 L/hr | 43.2 Nm³/hr | 50 L/hr × 0.864 = 43.2 Nm³/hr |
The above analysis clearly highlights a discrepancy of nearly 16% between the customer’s calculated Oxygen flow requirement and the actual flow required.
16% lower actual consumption vs. client estimate
Unit Conversion Table
In most cases, the liquid Oxygen supplier invoices the Oxygen gas in Sm³, Kg or Litres of Oxygen instead of Nm³. Please verify the units used to measure Oxygen gas accurately to determine the exact Oxygen requirement for your application. The table below helps you with this conversion:
Quick Conversion Reference
| Unit | Equivalent |
| 1 Sm³ of Oxygen gas | 0.95 Nm³ of Oxygen gas |
| 1 L LOX | 0.864 Nm³ of Oxygen gas |
| 1 Kg LOX | 0.75 Nm³ of Oxygen gas |
Wastage and Losses with Liquid Oxygen
Another key factor to consider is the process losses that occur during the use of liquid Oxygen
- Evaporation Loss/Boil-off: Liquid Oxygen is stored in large vacuum-insulated tanks installed outside at designated areas (as per the PESO guidelines). Since achieving 100% insulation is practically impossible, liquid Oxygen converts into gas when exposed to direct sunlight and atmospheric heat, leading to an increase in the pressure of Oxygen inside the liquid tank, which is then released into the atmosphere to maintain the pressure inside the tank within safety limits. This leads to loss of Oxygen gas (called evaporation loss or boil off). On average, daily evaporation losses can reach up to 3% of the total stored volume, and may be even higher depending on site-specific conditions.
- Filling losses: During the refilling of liquid Oxygen in liquid tanks, a lot of liquid Oxygen is wasted in the form of spillage, which is usually ignored.
- Unknown leftovers during refilling: Industries using liquid oxygen usually face this issue, where they have a fixed frequency of refilling liquid oxygen without taking into consideration the quantity of remaining liquid oxygen inside the tank at the time of refilling.
Loss Calculation
| Parameter | Value |
| Filling frequency | Every 24 hours |
| Evaporation loss | 3% |
| Filling + leftover loss | 1% |
| Total loss | 4% (~1.72 Nm³/hr) |
Actual Oxygen Requirement (After Absstem Audit)
| # | Parameters | Corrected Values |
| 1 | Oxygen Flow as per client | 50 Nm³/hr |
| 2 | Oxygen wastage (4% per day) | 1.72 Nm³/hr |
| 3 | Oxygen Flow (unit conversion) | 43.2 Nm³/hr |
| 4 | Actual Oxygen flow required by the client (Sr.3 – Sr.2) | 41.5 Nm³/hr |
Corrected Requirement: PSA vs VPSA Plants
| Parameter | Client Estimate | Absstem Recommendation (PSA Oxygen Plant) | Absstem Recommendation (VPSA Oxygen Plant) |
| Oxygen Flow | 50 Nm³/hr | 41.5 Nm³/hr | 41.5 Nm³/hr |
| Gas Pressure | 6 Barg | 3 Barg | 3 Barg |
| Purity | 99.9% | 90-96% | 90-96% |
| Plant Cost (CAPEX) | ₹90 Lakhs | ₹60 Lakhs | ₹100 Lakhs |
| Operational Cost (Annual OPEX) | ₹83 Lakhs | ₹32 Lakhs | ₹16 Lakhs |
As we can see, the difference was observable in terms of all parameters, i.e., flow, purity & wastage. The right choice of Oxygen plant for this particular industry can save more than 30% capital expense (in case of PSA Technology) and almost 3 to 5 times the operational cost, every year, in the case explained above. To understand more about PSA and VPSA oxygen plants, please read our blog titled, What is a VPSA or VSA Oxygen Generator ? (5).
Lifecycle Cost Impact
If you calculate the lifecycle cost, taking into consideration the life of a PSA or VPSA Oxygen plant is a minimum of 10 years, then we can easily say that the decision to buy the Oxygen plant as per the initial client data would have turned into an economic disaster. By contrast, PSA/VPSA plants deliver ROI in 12–30 months.
Conclusion
This case highlights three key lessons:
- Check unit conversions (litres vs Nm³ vs kg) to avoid oversizing.
- Match purity with application requirements – higher purity ≠ always better (unless it is needed).
- Account for wastage – evaporation and filling losses in liquid Oxygen add hidden costs.
- A PSA Oxygen Plant with 12-30 months ROI is a smarter, sustainable alternative to liquid Oxygen supply for different industries.
Consult Us
Looking to optimise your Oxygen cost? Contact our experts:
- Email: [email protected]
- Phone: 1800 3010 3394
- Website: absstem.com
References
- Absstem Technologies. (2025). Do We Really Know Our Gas Consumption and Cost?
- Absstem Technologies. (2025). Do You Really Know Your Gas Consumption and Cost? – Part II (Liquid Nitrogen)
- Absstem Technologies. (2025). Do You Really Know Your Gas Consumption and Cost? – Part III (Nitrogen Cylinders)
- Absstem Technologies. (2025). Comparison of the Cost of Oxygen Gas from Different Sources
- Absstem Technologies. (2025). What is a VPSA or VSA Oxygen Generator?
Q1: What is the actual cost of liquid oxygen compared to PSA and VPSA oxygen?
Q2: Why is 99.9% liquid oxygen purity unnecessary for brazing?
Q3: How do you convert liquid oxygen (L) into Nm³?
Q4: What are the hidden losses with liquid oxygen storage?
Q5: What was the corrected oxygen requirement in the case study?
Q6: How do PSA and VPSA oxygen plants reduce lifecycle costs compared to LOX?
Q7: What unit pitfalls cause errors in LOX billing?
Q8: Why is PSA oxygen more sustainable than liquid oxygen?
Q9: Comparison or differences between Liquid Oxygen (LOX), PSA and VPSA Oxygen Plants?
Parameter | Liquid Oxygen | PSA Oxygen Plant | VPSA Oxygen Plant |
Purity | 99.9% (default) | 90-96% | 90-96% |
Cost (₹/Nm³) | 18.90 | 8.80 | 4.40 |
Losses | Evaporation, filling, leftover | Minimal | Minimal |
CAPEX | None (rental model) | ₹60 Lakhs | ₹100 Lakhs |
OPEX (annual) | ₹83 Lakhs | ₹32 Lakhs | ₹16 Lakhs |
ROI | N/A | 12-30 months | 12-30 months |